Plotting
ReMeta includes three methods that offer some basic plotting functionality of type 1 and 2 data.
To illustrate, we simulate a dataset:
cfg = remeta.Configuration()
params = dict(
    type1_noise=0.5,
    type1_bias=0.15,
    type2_noise=0.2,
    type2_criteria=[0.25, 0.5, 0.75] # corresponds to 4 confidence ratings
)
ds = remeta.simulate(n_samples=1000, params=params, squeeze=True, stim_levels=4, cfg=cfg)
----------------------------------
..Generative model:
Type 1 noise distribution: normal
Type 2 noise type: report
Type 2 noise distribution: beta_mode
..Generative parameters:
type1_noise: 0.5
type1_bias: 0.15
type2_noise: 0.2
type2_criteria: [0.25 0.5 0.75]
[extra] Criterion bias: 0.0000
[extra] Criterion-based confidence bias: 0.0000
..Descriptive statistics:
No. subjects: 1
No. samples: 1000
No. of discrete confidence levels: 4
Accuracy: 84.6% correct
d': 2.1
Choice bias: 6.4%
Confidence: 0.66
M-Ratio: 1.14
AUROC2: 0.81
----------------------------------
... and fit a ReMeta model:
cfg.optim_type2_gridsearch = False
rem = remeta.ReMeta(cfg)
rem.fit(ds.stimuli, ds.choices, ds.confidence, n_ratings=4)
result = rem.summary()plot_psychometric
Data-driven psychometric curve:
remeta.plot_psychometric(ds.stimuli, ds.choices)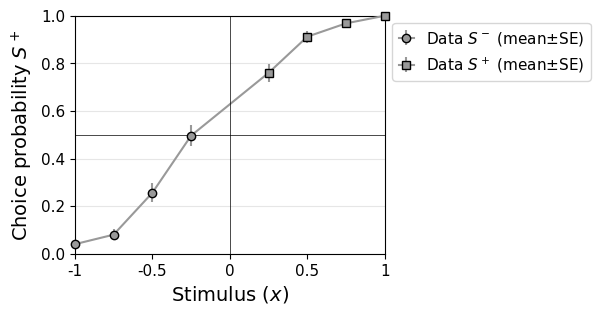
Plot data alongside fitted parameters. In this case, plot_psychometric can be called from the ReMeta object:
rem.plot_psychometric()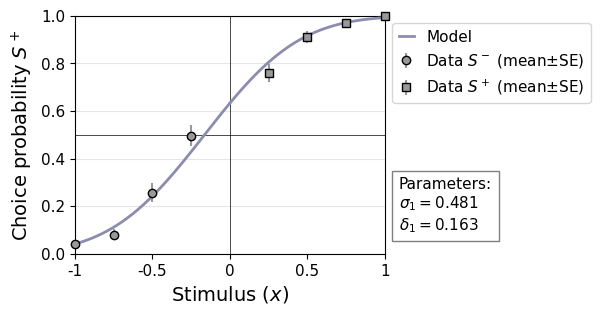
Plot model only:
rem.plot_psychometric(model_only=True)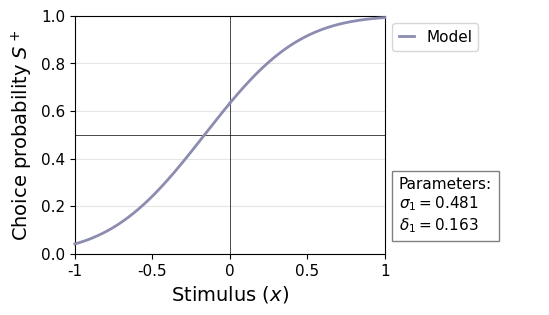
Plot arbitray (theoretical) psychometric curve:
remeta.plot_psychometric(type1_noise_dist='normal', type1_noise=0.5, type1_bias=-0.2)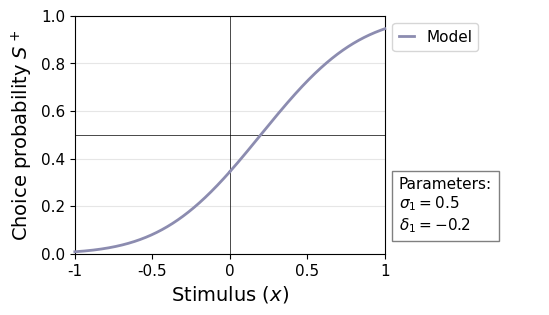
plot_stimulus_versus_confidence
Data-driven plot:
remeta.plot_stimulus_versus_confidence(ds.stimuli, ds.confidence, ds.choices)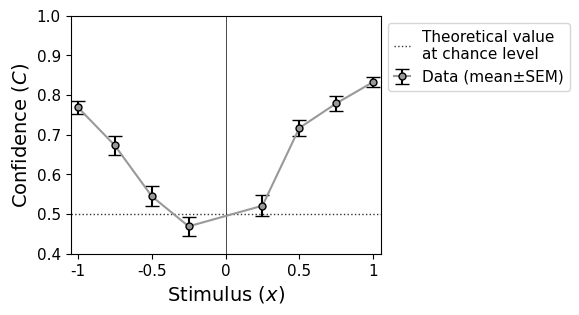
Plot data alongside fitted parameters. In this case, plot_stimulus_versus_confidence can be called from the ReMeta object:
rem.plot_stimulus_versus_confidence()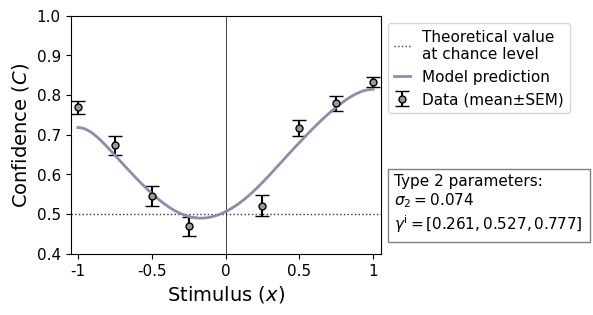
Separate by accuracy:
rem.plot_stimulus_versus_confidence(separate_by_accuracy=True)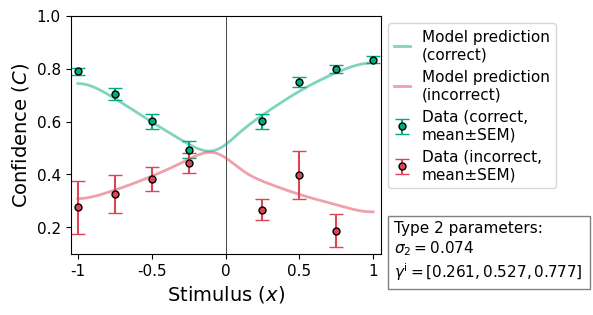
Plot model only:
rem.plot_stimulus_versus_confidence(model_only=True)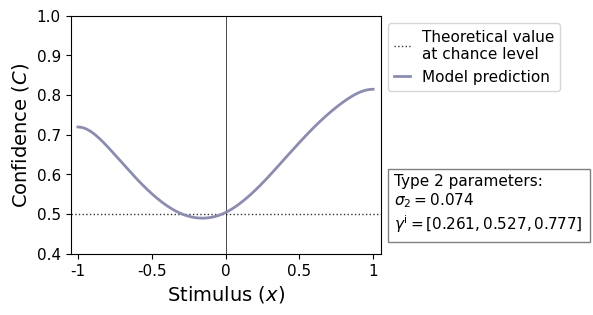
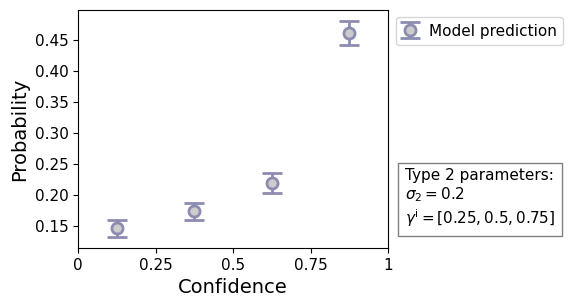
Plot arbitray (theoretical) stimulus-confidence relationship (reqiores at least type1_noise and type2_noise):
remeta.plot_stimulus_versus_confidence(type1_noise=0.5, type2_noise=0.2)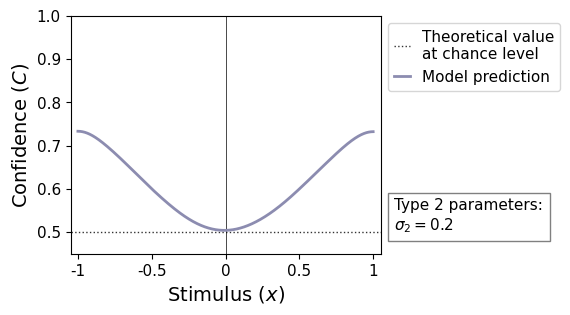
plot_confidence_histogram
Data-driven plot:
remeta.plot_confidence_histogram(ds.confidence)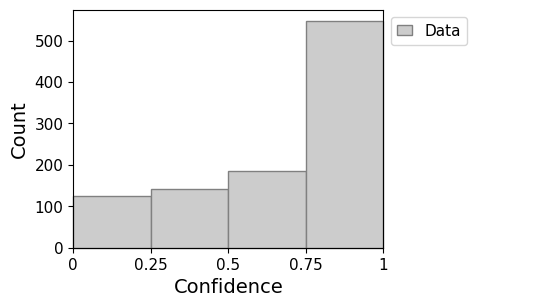
Plot data alongside fitted parameters. In this case, plot_confidence_histogram can be called from the ReMeta object:
rem.plot_confidence_histogram()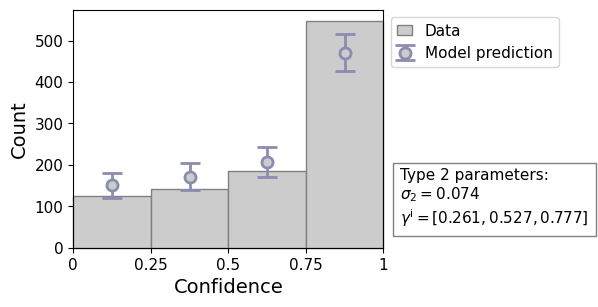
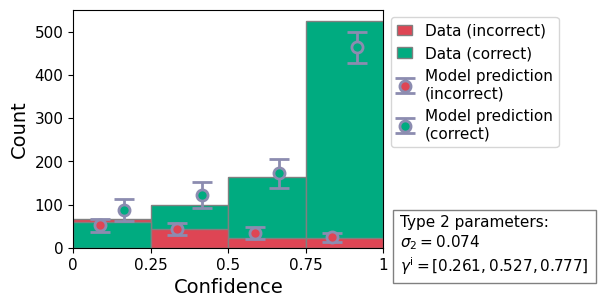
Separate by accuracy:
rem.plot_confidence_histogram(separate_by_accuracy=True)1000 2000
Separate by stimulus category:
rem.plot_confidence_histogram(separate_by_category=True)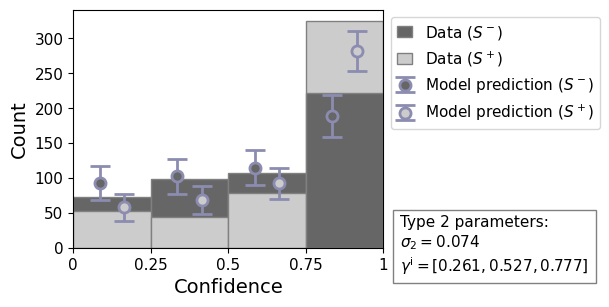
Plot model only:
rem.plot_confidence_histogram(model_only=True)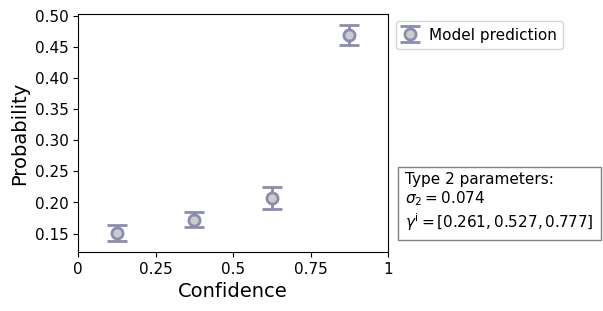
Plot arbitray (theoretical) confidence distribution (reqiores at least type1_noise and type2_noise):
remeta.plot_confidence_histogram(type1_noise=0.5, type2_noise=0.2)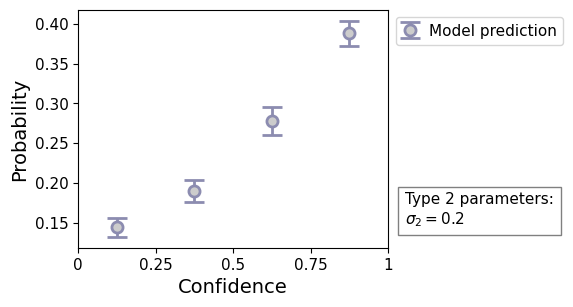
Change the type 2 noise distribution by passing a Configuration object:
cfg.param_type2_noise.distribution = 'truncated_normal_mode'remeta.plot_confidence_histogram(
type1_noise=0.5, type2_noise=0.2, type2_criteria=[0.25, 0.5, 0.75], cfg=cfg
)